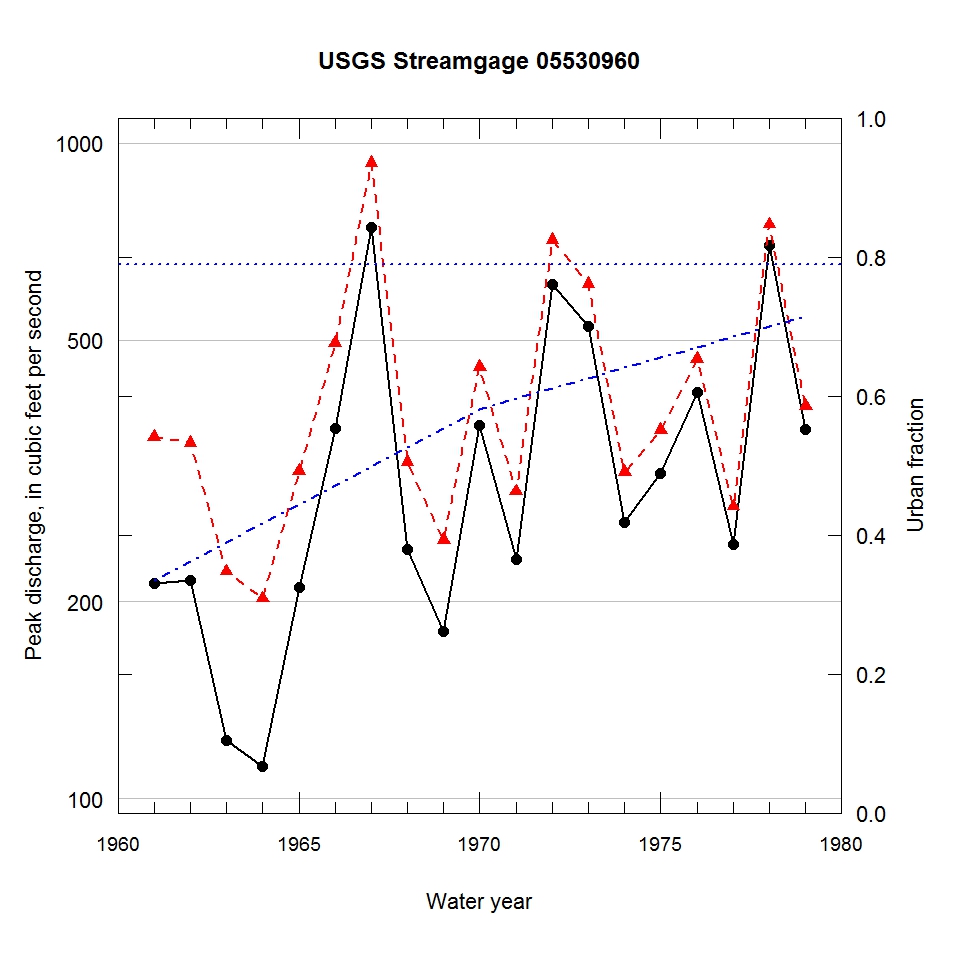
Observed and urbanization-adjusted annual maximum peak discharge and associated urban fraction and precipitation values at USGS streamgage:
05530960 SALT CREEK NEAR PALATINE, IL


| Water year | Segment | Discharge code | Cumulative reservoir storage (acre-feet) | Urban fraction | Precipitation (inches) | Observed peak discharge (ft3/s) | Adjusted peak discharge (ft3/s) | Exceedance probability |
| 1961 | 1 | -- | 0 | 0.334 | 1.351 | 213 | 356 | 0.518 |
| 1962 | 1 | -- | 0 | 0.362 | 0.260 | 215 | 349 | 0.536 |
| 1963 | 1 | -- | 0 | 0.389 | 1.750 | 123 | 222 | 0.868 |
| 1964 | 1 | -- | 0 | 0.417 | 0.739 | 112 | 202 | 0.907 |
| 1965 | 1 | -- | 0 | 0.444 | 0.560 | 210 | 316 | 0.628 |
| 1966 | 1 | -- | 0 | 0.472 | 1.218 | 367 | 495 | 0.213 |
| 1967 | 1 | -- | 0 | 0.499 | 1.290 | 744 | 932 | 0.023 |
| 1968 | 1 | -- | 0 | 0.526 | 3.277 | 240 | 326 | 0.601 |
| 1969 | 1 | -- | 0 | 0.554 | 2.109 | 180 | 248 | 0.808 |
| 1970 | 1 | -- | 0 | 0.581 | 2.395 | 371 | 455 | 0.278 |
| 1971 | 1 | 2 | 0 | 0.596 | 0.380 | 232 | 294 | 0.692 |
| 1972 | 1 | -- | 0 | 0.611 | 1.578 | 609 | 711 | 0.063 |
| 1973 | 1 | -- | 0 | 0.626 | 1.816 | 526 | 610 | 0.112 |
| 1974 | 1 | -- | 0 | 0.641 | 0.947 | 264 | 315 | 0.631 |
| 1975 | 1 | -- | 0 | 0.656 | 1.587 | 314 | 365 | 0.497 |
| 1976 | 1 | -- | 0 | 0.670 | 1.612 | 417 | 468 | 0.254 |
| 1977 | 1 | -- | 0 | 0.685 | 0.703 | 244 | 279 | 0.734 |
| 1978 | 1 | -- | 0 | 0.700 | 1.904 | 697 | 751 | 0.050 |
| 1979 | 1 | -- | 0 | 0.715 | 0.504 | 366 | 397 | 0.418 |

